
Latest Pictures & Videos
 Citation M2 – flight from JFK to FXE06/11/2015 - 8:12 PM
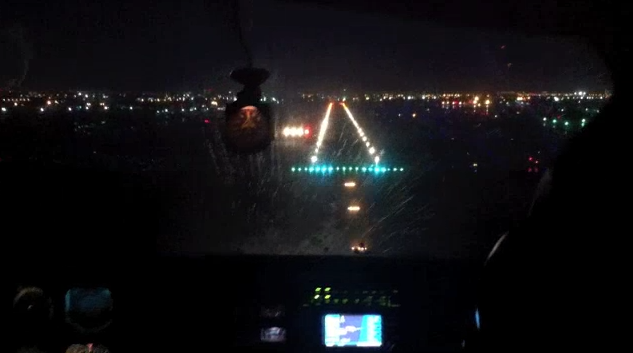 Night VFR – Miami26/10/2014 - 4:25 PM
 Engine Failure on a Seneca – Full sequence24/10/2014 - 4:33 PM
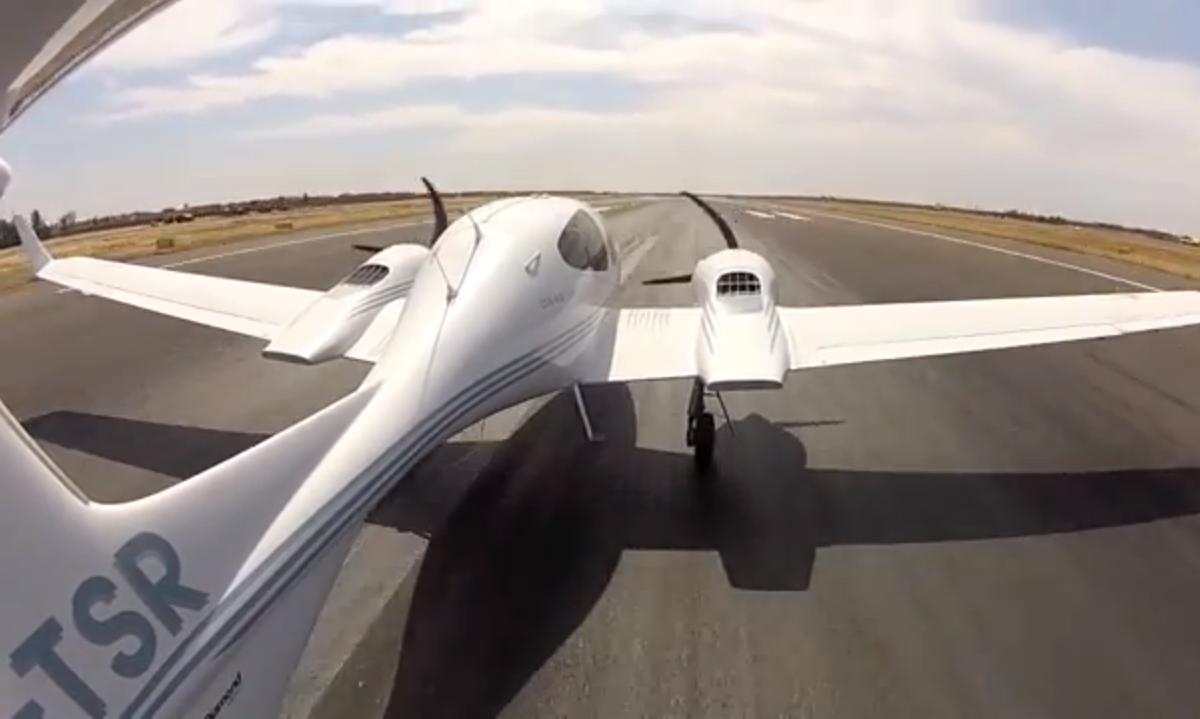 Multi Engine Commercial Training – Marrakech15/09/2014 - 4:06 PM
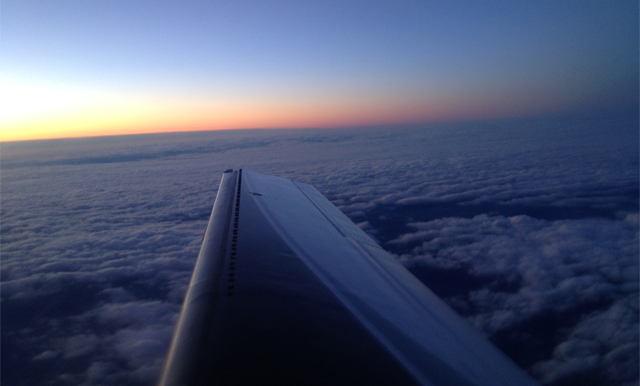 Piper Meridian – From Caen to Pontoise05/02/2014 - 1:06 PM
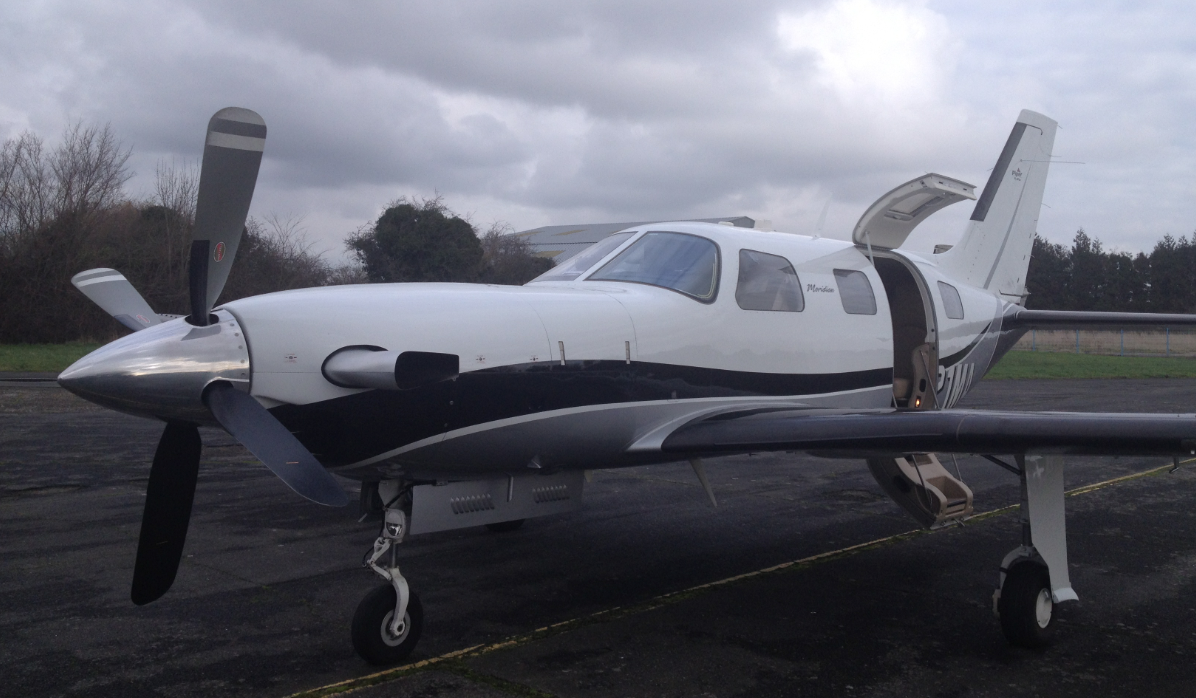 Piper Meridian – From Pontoise to Caen03/02/2014 - 3:43 PM
 Piper Meridian – From Belgium to France30/12/2013 - 3:49 PM
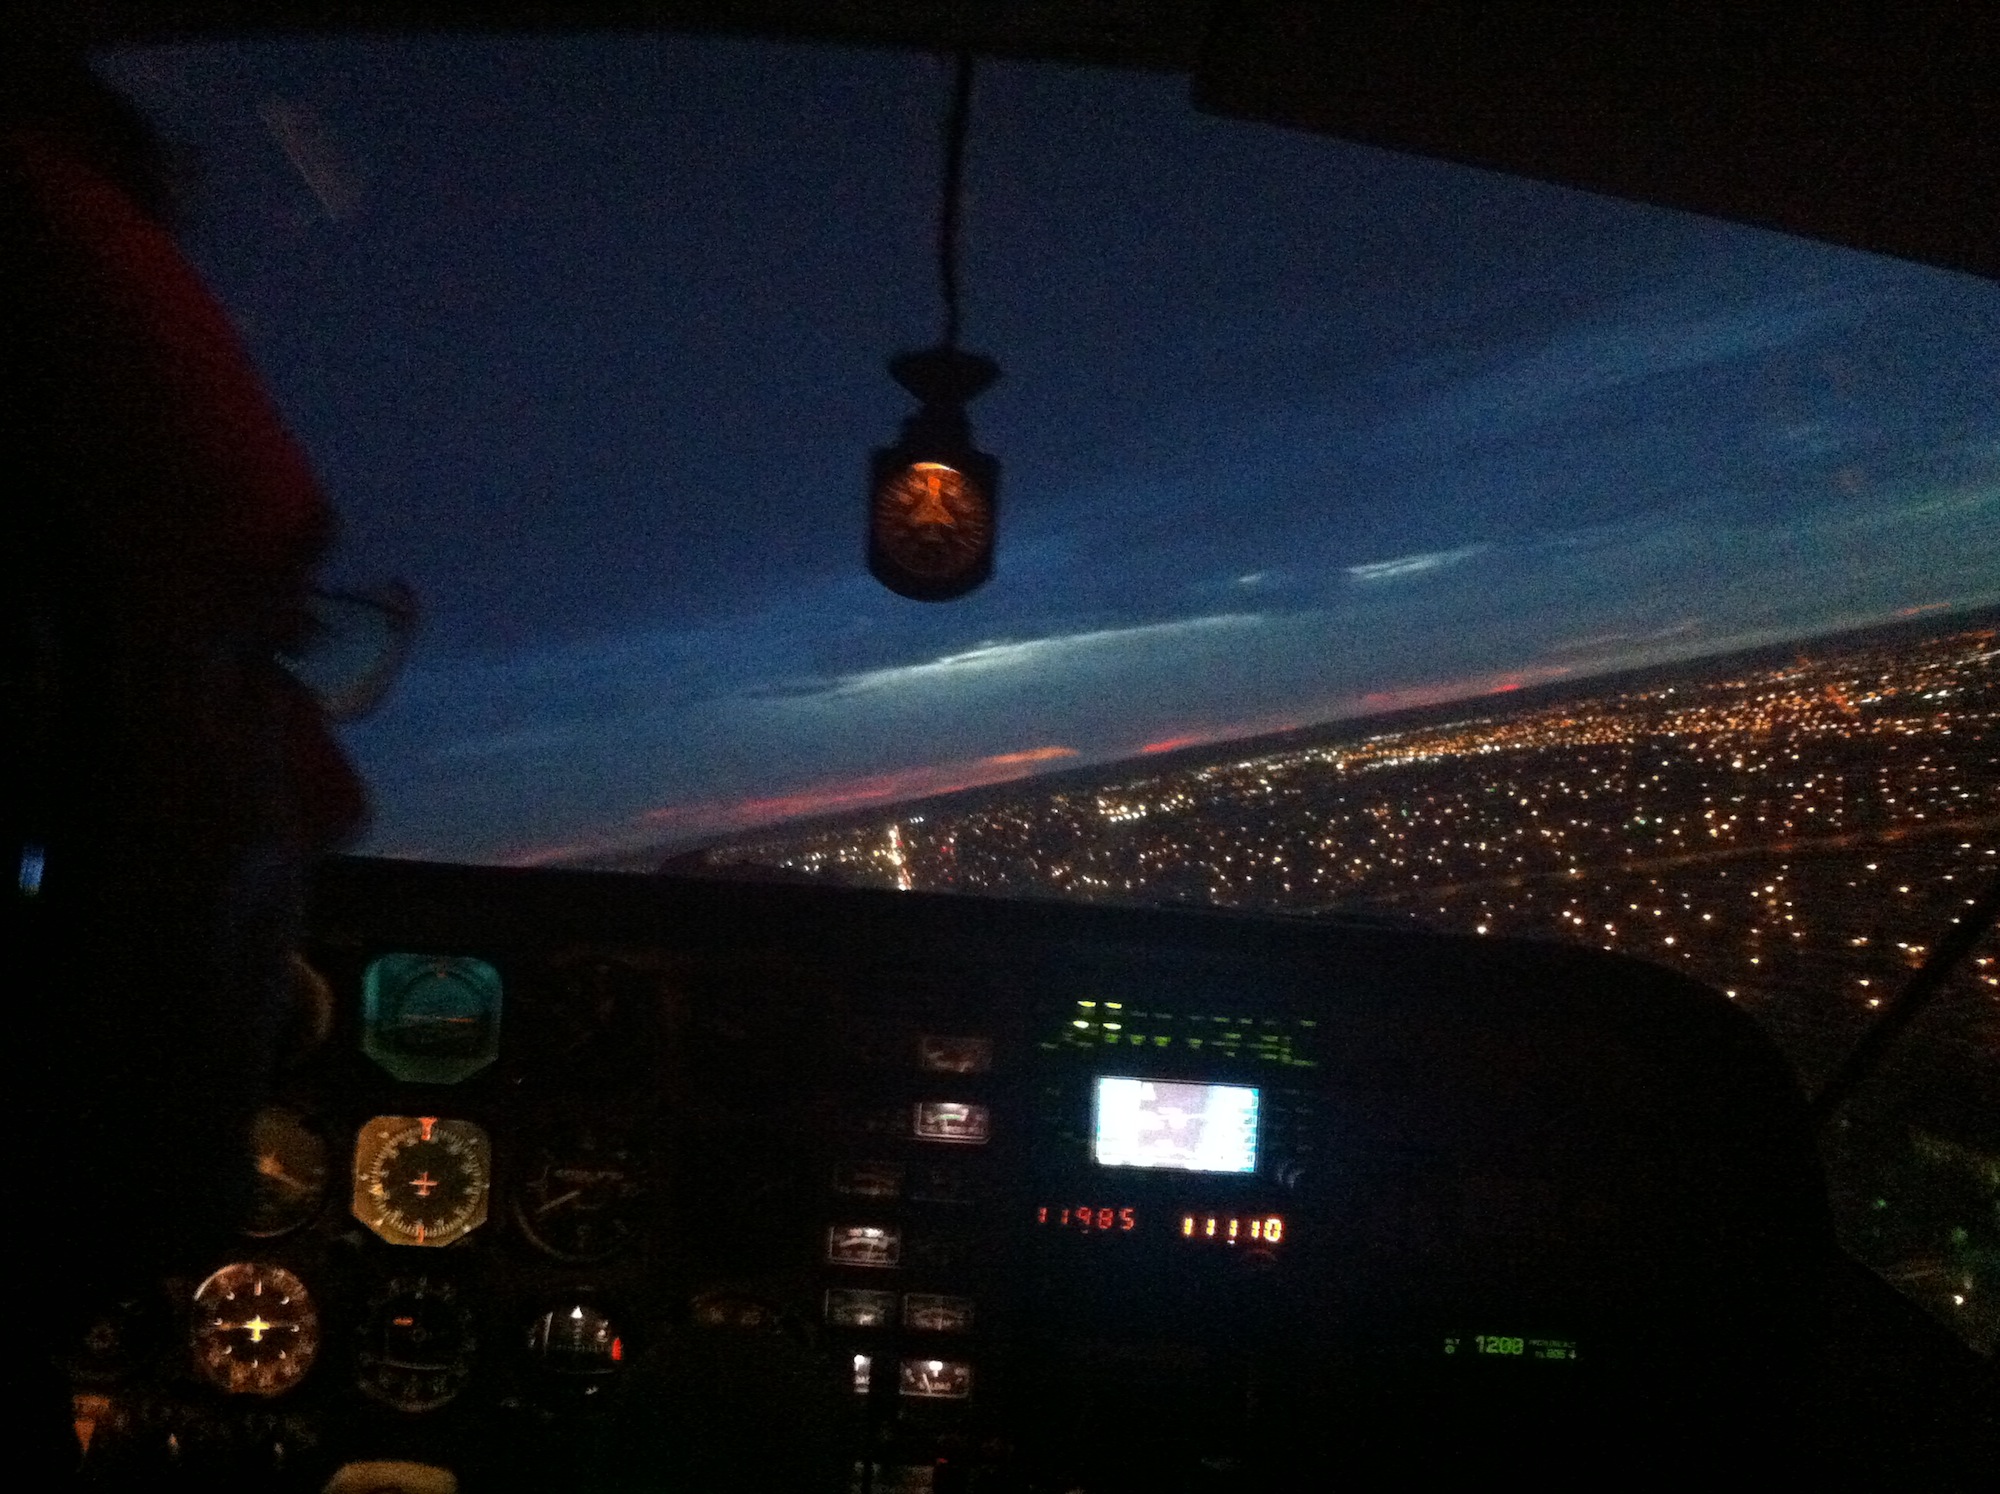 Night VFR – Miami25/10/2013 - 4:28 PM